Welcome to Spring Valley, a residential neighborhood in Northwest Washington, DC, on land once largely owned by American University. It was the flagship development of the W.C. and A.N. Miller Companies, which sold its first homes here in 1928 and kept building in the neighborhood for decades. Nebraska Avenue, Loughboro Road, Dalecarlia Parkway and Massachusetts Avenue frame it.
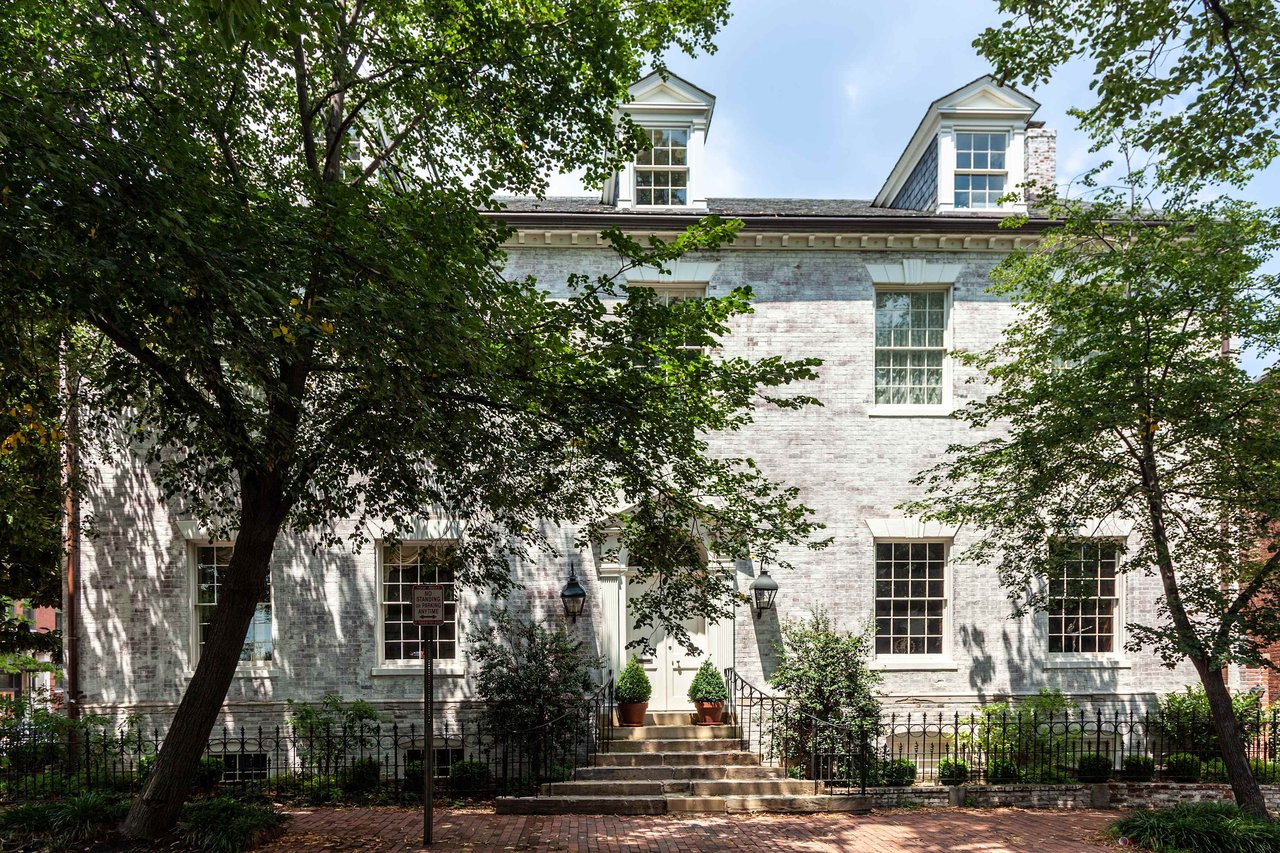
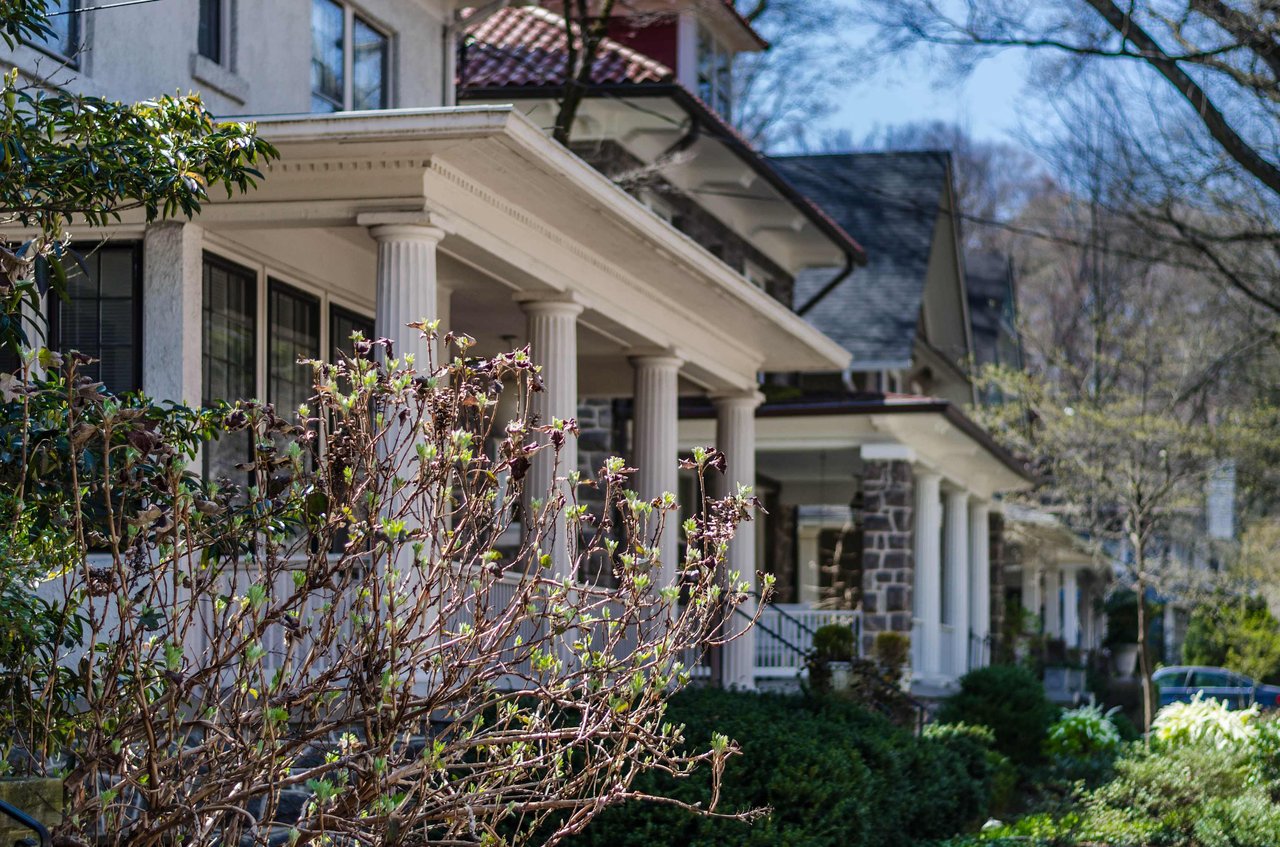
Spring Valley’s housing is primarily detached single-family homes on generous lots, many with mature landscaping and garages. Dalecarlia Parkway and Massachusetts Avenue meet at Westmoreland Circle on the Maryland line. The neighborhood is more car-oriented than much of DC, and its wooded streets give it a quiet, residential feel.
Current market numbers: See the latest Washington, DC market report from Altos Research , or visit our DC Area Market Reports page.
4,326 people live in Spring Valley, where the median age is 39 and the average individual income is $127,161. Data provided by the U.S. Census Bureau.
Total Population
Median Age
Population Density Population Density This is the number of people per square mile in a neighborhood.
Average individual Income
There's plenty to do around Spring Valley, including shopping, dining, nightlife, parks, and more. Data provided by Walk Score and Yelp.
Explore popular things to do in the area, including Ana’s Market, and Sila Sveta.
| Name | Category | Distance | Reviews |
Ratings by
Yelp
|
|---|---|---|---|---|
| Shopping | 0.3 miles | 0 reviews | 0/5 stars | |
| Active | 0.04 miles | 0 reviews | 0/5 stars | |
|
|
||||
|
|
||||
|
|
||||
|
|
||||
|
|
||||
|
|
Spring Valley has 804 households, with an average household size of 2. Data provided by the U.S. Census Bureau. Here’s what the people living in Spring Valley do for work — and how long it takes them to get there. Data provided by the U.S. Census Bureau. 4,326 people call Spring Valley home. The population density is 8,911 and the largest age group is Data provided by the U.S. Census Bureau.
Total Population
Population Density Population Density This is the number of people per square mile in a neighborhood.
Median Age
Men vs Women
Population by Age Group
0-9 Years
10-17 Years
18-24 Years
25-64 Years
65-74 Years
75+ Years
Education Level
Total Households
Average Household Size
Average individual Income
Households with Children
With Children:
Without Children:
Marital Status
Blue vs White Collar Workers
Blue Collar:
White Collar: