Welcome to Woodley Park, a Northwest Washington, DC, neighborhood with restaurants and shops along Connecticut Avenue. It’s home to the Smithsonian’s National Zoological Park and is bordered by Rock Creek Park to the east. It’s named for Woodley House, and the Woodley Park-Zoo/Adams Morgan Metro station sits on Connecticut Avenue. The Duke Ellington Bridge carries Calvert Street across Rock Creek.
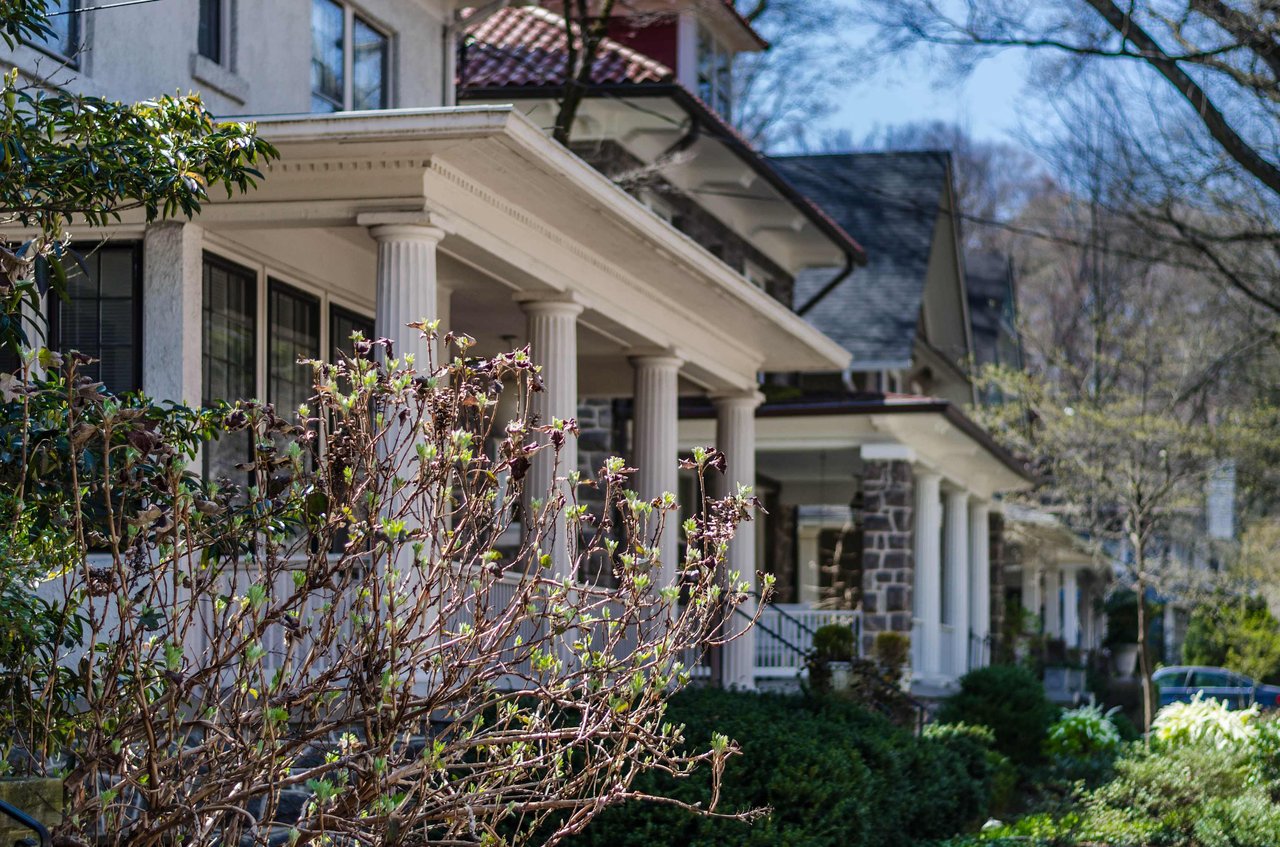
Housing in Woodley Park includes early 20th-century rowhouses and semi-detached homes, along with apartment and co-op buildings along Connecticut Avenue. Cleveland Park lies to the north, Adams Morgan to the east, and Rock Creek Park’s trails are steps away, offering miles of wooded paths through the heart of the city.
Current market numbers: See the latest Washington, DC market report from Altos Research , or visit our DC Area Market Reports page.
6,629 people live in Woodley Park, where the median age is 38 and the average individual income is $108,445. Data provided by the U.S. Census Bureau.
Total Population
Median Age
Population Density Population Density This is the number of people per square mile in a neighborhood.
Average individual Income
There's plenty to do around Woodley Park, including shopping, dining, nightlife, parks, and more. Data provided by Walk Score and Yelp.
Explore popular things to do in the area, including Zoo Wine & Spirits, Sosan, and Nejla.
| Name | Category | Distance | Reviews |
Ratings by
Yelp
|
|---|---|---|---|---|
| Dining | 0.24 miles | 3 reviews | 5/5 stars | |
| Shopping | 0.38 miles | 1 review | 2/5 stars | |
| Beauty | 0.23 miles | 0 reviews | 0/5 stars | |
|
|
||||
|
|
||||
|
|
||||
|
|
||||
|
|
||||
|
|
Woodley Park has 3,706 households, with an average household size of 2. Data provided by the U.S. Census Bureau. Here’s what the people living in Woodley Park do for work — and how long it takes them to get there. Data provided by the U.S. Census Bureau. 6,629 people call Woodley Park home. The population density is 28,175 and the largest age group is Data provided by the U.S. Census Bureau.
Total Population
Population Density Population Density This is the number of people per square mile in a neighborhood.
Median Age
Men vs Women
Population by Age Group
0-9 Years
10-17 Years
18-24 Years
25-64 Years
65-74 Years
75+ Years
Education Level
Total Households
Average Household Size
Average individual Income
Households with Children
With Children:
Without Children:
Marital Status
Blue vs White Collar Workers
Blue Collar:
White Collar: